Education, tips and tricks to help you conduct better fMRI experiments.
Sure, you can try to fix it during data processing, but you're usually better off fixing the acquisition!

Wednesday, December 13, 2017

COBIDAcq?


WARNING: this post contains sarcasm and some swearing.
(But only where absolutely necessary.)


COBIDAcq, pronounced "Koby-dack," is the Committee on Best Practice in Data Acquisition. It is based on the similarly dodgy acronym, COBIDAS: Committee on Best Practice in Data Analysis and Sharing. I suppose COBPIDAAS sounds like a medical procedure and CBPDAS is unpronounceable, so COBIDAS here we are.

Unlike COBIDAS, however, the COBIDAcq doesn't yet exist. Do we need it? The purpose of this post is to wheel out the idea and invite debate on the way we do business.

Saturday, December 9, 2017

FMRI data modulators 2: Blood pressure


If you conduct fMRI experiments then you'll have at least a basic understanding of the cascade of events that we term neurovascular coupling. When the neuronal firing rate increases in a patch of brain tissue, there is a transient, local increase of the cerebral blood flow (CBF). The oxygen utilization remains about the same, however. This produces a mismatch in the rate of oxygen delivered compared to the rate of oxygen consumption. The CBF goes up a lot while the oxygenation usage increases only slightly. Hence, there is a decrease in the concentration of deoxygenated hemoglobin in the veins draining the neural tissue region, in turn reducing the degree of paramagnetism of these veins that yields a signal increase in a T2*-weighted image. The essential point is that it's blood delivery - changes in CBF - that provides the main impetus for BOLD contrast.


How is blood pressure related to CBF?

The average CBF in a normal adult brain is typically maintained at around 50 ml of blood per 100 g of brain tissue per minute (50 ml/100g/min). The average number, while useful, represents considerable spatial and temporal heterogeneity across the brain. The typical CBF in gray matter is approximately double that in white matter, and there is significant variation across each tissue type arising from tight metabolic coupling. (See Note 1.)

At the local level, blood delivery to tissue is controlled by smooth muscles on the walls of arterioles and capillaries. The degree of vessel dilation, relative to that vessel's maximum possible dilation, is called its tone - the vascular tone. There are mechanisms to expand or constrict the smooth muscles, changing the local blood flow in order to maintain the tight local coupling of CBF to metabolic demand while protecting the vasculature and the tissue against damage that might arise with systemic changes in the blood supply from non-neural mechanisms. The totality of these processes is referred to as cerebral autoregulation. More on the non-neural factors later.

This is all very well, but there is something important missing from this picture. We have neglected to consider so far that the force of blood pumped out of the heart creates a pressure gradient across the arteries and the veins, with the tissue providing a resistance in between. It's this pressure gradient that causes the blood to flow. In fact, simple electrical circuits are a convenient model here. For those of you more familiar with electron flow than blood flow, we can think of the CBF as an analog of electrical current, the pressure difference as a voltage and, naturally enough, the tissue's resistance to flow mimics an electrical resistance. Thus we get:

CBF = CPP / CVR

where CPP is the cerebral perfusion pressure, the net pressure gradient - the driving force - that generates perfusion of brain tissue, and CVR is the cerebrovascular resistance. The CVR is the sum total of all mechanisms exerting control over the vascular tone at a particular location. It isn't easily estimated without detailed knowledge of the processes that might be active. The neurovascular coupling pathways contribute to CVR, for example.

Thursday, October 5, 2017

FMRI data modulators 1: Heart rate


It's 2027 and you are preparing to run a new fMRI experiment. Since 2023 you've been working on a custom 7 T scanner that was developed to mitigate several issues which plagued the early decades of fMRI. Long gone are the thermal shim and gradient drifts of yesteryear, courtesy of an intelligent water cooling system that maintains all hardware at near constant temperature even when the scanner is run flat out. Your scanner also has a custom gradient set with active shielding over the subject's chest. It means the rise time of the gradients is limited only by peripheral nerve stimulation in the subject's face and scalp, not by the possibility of causing fibrillation in the heart. You can use a slew rate four times faster than on the scanner you had back in 2017, meaning distortions of your 1 mm cubic voxels, acquired over the entire brain (including cerebellum!) are minuscule. What's more, your images no longer suffer from translations and shearing because of the subject's chest motion. Your scanner tracks the magnetic field across the subject's head and actively compensates for the effects of breathing. When used with the comfortable head restraint system that mates directly to the receiver electronics - which itself monitors changes in coil loading to ensure the 128-channel array coil doesn't impart its own bias field onto your images - you have finally got to the point in your career where you no longer worry about head motion.

Almost. There's no doubt the hardware of the future could be remarkable compared to today's scanners. Our current scanners are clinical products being used for science rather than scientific instruments per se. However, even if we were to supersede BOLD with a non-vascular "neural current" contrast mechanism, the basic physics of MRI suggests that we will have to consider real brain motion in the future, just as we do today. Perhaps we can differentiate this brain motion from the contrast of interest using multiple echoes or some other trick, but I don't envisage being able to ignore the brain's vasculature entirely, whereas I am optimistic that improved scanner engineering might one day ameliorate the mechanical and thermal instabilities. Real brain motion and regional variation in pulsatility are likely to be biological limits that must be accommodated rather than eliminated.


What are the mechanisms of concern?

We can restrain the subject's skull quite well using a bite bar or a printed case. Inside the skull, however, is a gelatinous blob of brain, highly vascularized, under a small positive pressure (the intracranial pressure, ICP). The brain will tend to throb with the heart rate (HR) as blood is pumped into the brain through the arteries. The arterial network is spatially heterogeneous and so we see heterogeneous motion across the brain. The arteries enter at the base of the brain, causing the entire midbrain and brainstem to move relative to the cortex. Locally, tissue close to large vessels can demonstrate greater displacements than tissue just a few millimeters away. These regional perturbations will arise with a range of delays relative to the cardiac output, as the blood pressure wave migrates from the heart. The greater the distance from the heart, the longer the lag. We'll see in a later post how this phenomenon can be used to estimate blood pressure.

There are also cardiac driven pulsations in the cerebrospinal fluid (CSF). These can be visualized as small displacements of tissue adjacent to the ventricular system as well as in sulci of the cortex. Pulsation in CSF and the changing velocity of blood in large vessels also tend to produce image contrast changes. This isn't real brain motion, of course, but it is a consideration if one is attempting to use local signal properties or overall image contrast to ameliorate regional pulsatility. A new paper by Viessmann et al. provides a timely investigation of the issues, concluding that fluctuations in partial volumes of blood and CSF/interstitial fluid give rise to local T2* changes over the cardiac cycle. So the final complexity is again temporal. The cardiac cycle is itself non-stationary, leading to dynamic changes in the locations of blood, CSF and brain tissue.

Tuesday, August 22, 2017

Fluctuations and biases in fMRI data


In my last post I summarized the main routes by which different forms of actual or apparent motion can influence fMRI data. In the next few posts, I want to dig a little deeper into non-neural causes of variation in fMRI data. I am particularly interested in capturing information on the state of the subject at the time of the fMRI experiment. What else can be measured, and why might we consider measuring it? Brains don't float in free space. They have these clever life support systems called bodies. While most neuroimagers reluctantly accept that these body things are useful for providing glucose and oxygen to the brain via the blood, bodies can also produce misleading signatures in fMRI data. My objective in this series of posts is to investigate the main mechanisms giving rise to fluctuations and biases in fMRI data, then consider ways other independent measurements might inform the fMRI results.

Many causes, much complexity

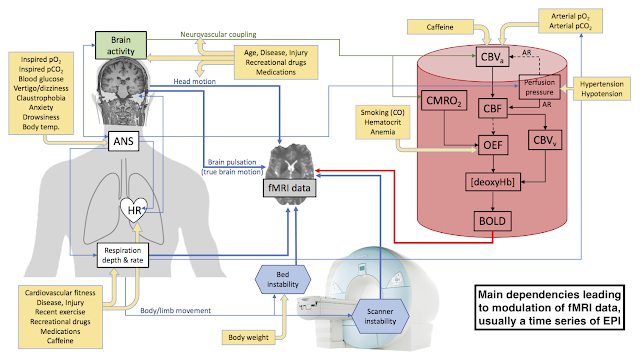
There are three broad categories of fluctuations or biases imprinted in the fMRI data. I've tried to depict them in Figure 1. At top-right, in a cartoon red blood vessel, is the cascade of physiological events leading to BOLD contrast. Next, on the left, there are perturbations arising from the subject's body. Some of these are direct effects, like head motion, and some are propagated via modulation of the same physiological parameters that give rise to BOLD. Breathing is a good example of the latter. A change in breathing depth or frequency can change the arterial concentration of CO2, leading to non-neural BOLD changes. Furthermore, the breathing rate is intricately tied to the heart rate, via the vagus nerve, and so we can also expect altered brain pulsation. In the final category, depicted in my figure as scanner-based mechanisms at the bottom, we have experimental imperfections. In the last group are things that could be reduced or eliminated in principle, such as thermal drift in the gradients, wobbly patient beds, and resonance frequency shifts across the head arising from changing magnetic susceptibility of the chest during breathing. The thin blue lines connecting the different parts of the figure are supposed to show the main influences, with arrowheads to illustrate the directionality.

(Click image to enlarge.)

Figure 1. Major routes of modulation in time series data in an fMRI experiment. The flow chart in the depiction of a blood vessel, in red, is based on a figure from Krainik et al. 2013 and shows the main events leading to BOLD via neurovascular coupling. Main body-based mechanisms originate on the left, and scanner-based experimental imperfections are depicted on the bottom. All mechanisms ultimately feed into the fMRI data, depicted at center. Yellow boxes contain some of the main modulators of mechanisms that can produce either fluctuations or systematic biases in fMRI data.

Abbreviations: ANS - autonomic nervous system, HR - heart rate, CBVa - arterial cerebral blood volume, CBVv - venous cerebral blood volume, CMRO2 - cerebral metabolic rate of oxygen utilization, CBF - cerebral blood flow, OEF - oxygen extraction fraction, deoxyHb - deoxyhemoglobin, AR - autoregulation, pO2 - partial pressure of oxygen (O2 tension), pCO2 - partial pressure of carbon dioxide (CO2 tension).


As if that wasn't already a lot of complexity, I'm afraid there's more. In the yellow boxes of Figure 1 are some of the main modulators of the underlying mechanisms responsible for perturbing fMRI data. These modulators are usually considered to be confounds to the main experimental objective. I posted a list of them a few years ago. Caffeine is probably the best known. It modulates both the arterial cerebral blood volume (CBVa) as well as the heart rate (HR). We already saw that HR and breathing are coupled, so this produces a third possible mechanism for caffeine to affect fMRI data. There's also an obvious missing mechanism: its neural effects. Some direct neural modulators are summarized in Figure 2, placed in their own figure simply to make this a tractable project. I'll be going back to reconsider any direct neural effects at the end of the series, to make sure I've not skipped anything useful, but my main emphasis is the contents of Figure 1.

Figure 2. Potential modulators of neural activity during an fMRI experiment.


Measuring the modulators

There are about a dozen mechanisms leading to fluctuations in fMRI data. Note that some paths depicted in Figure 1 may contain multiple discrete mechanisms. The figure would be far too cluttered if every mechanism was depicted. Take head motion. It could be foam compressing through no fault of the subject, or it could be the subject fidgeting, or apparent head motion arising from the sensitivity of the EPI acquisition to off-resonance effects (for which there are at least two main contributions: thermal drift in the scanner and chest motion in the subject). I tried to estimate how many combinations are represented in Figure 1 but quickly gave up. It's several dozen. I'm not sure that knowing the number helps us. Clearly, it's an omelette.

So, what can we do about it? Well, there are only so many things one can measure before, during or after an MRI scan, so we should probably start there. In the first set of posts in this series I'll look at non-MRI measures that can be performed during fMRI data acquisition, to track moment to moment changes in some of the parameters of Figure 1. These will include:

Then, in the next set of posts I'll shift to assessing ancillary MRI measurements that can inform an fMRI experiment, such as:
  • Anatomical scans
  • Baseline CBF
  • Blood oxygenation
  • Cerebrovascular reactivity
  • Calibrated fMRI (which is actually a slightly different way of doing the fMRI experiment, but requires some ancillary steps)

Finally, I'll consider informative, non-MRI data you could capture from questionnaires or relatively simple non-invasive testing. With better understanding, I am hoping that more researchers begin to consider physiology as earnestly as they do the domains involving psychology and statistics.

Thursday, April 13, 2017

Major sources of apparent head motion in fMRI data


As I mentioned yesterday, there is a tendency when reviewing the output of a volume registration ("motion correction") algorithm to attribute all variations to real head motion. But, as was demonstrated last October, the magnetic susceptibility of the chest during breathing produces shifts in the magnetic field that vary spatially across the head, producing translations and shearing in EPI data that the volume registration algorithm can't distinguish from real head motion. Here I want to quickly review other major mechanisms by which we can get apparent head motion.

Let's start with contributions to real head motion. These include slow compression of foam designed to restrain the head, relaxation or tension of neck muscles, swallowing, fidgeting and the like. Printed head cases, bite bars and other restraint systems are of use here. Then there are body motions, including the extremities, that produce movement of the head via the neck. This is why you should instruct your subjects not to move at all during the scan. Telling a subject he shouldn't move his head is tantamount to saying that moving his feet is okay, and it's not. Subjects should move, e.g. to scratch or stretch, only when the scanner is silent.

Also included in the mechanical motion category is respiratory chest motion that couples unavoidably to the head because of that pesky neck thing. Pulsations of the brain with the cardiac cycle are another source of unavoidable direct motion in the organ of interest. The latter is real brain motion, of course.

Next, body motions (including from respiration) can produce head movement in the magnetic field via instability of the patient bed. Back in the early 2000s we had a Varian 4 T scanner. We had to construct rollers to catch and support the bed sled in the magnet bore because we had a cantilevered bed that deflected like a springboard otherwise. Every tiny movement of the subject caused the bed sled to bounce. For stability we want a strongly coupled system - subject to bed, bed to gradients/magnet - and we need to avoid any relative movement between them. I was reminded of this mechanism again recently. It's something to keep in mind as we work on respiratory instabilities because I note that my Trio has a bed cantilevered on the magnet face whereas Prisma scanners have a bed supported on the floor in front of the magnet. The latter should be a lot more stable, provided the bed has a solid foundation underneath it.

So far all the mechanisms I've considered have had a direct mechanical connection between the source of the motion and the brain. Chest motion can also affect the magnetic field via changing magnetic susceptibility from the air-filled lungs, as previously demonstrated. This is a through-space mechanism. In principle, movement of the extremities or any other part of the body (or other equipment in the bore) might also produce perturbation of the magnetic field across the head via magnetic susceptibility, but my intuition is that this would be a minor contributor to overall instability compared to the effects from the chest.

A well-known motion-like effect arises from thermal drift in the magnet. The gradients get warm with use and over time this causes drift in the magnetic field, e.g. via passive shimming iron that doesn't have the water cooling of the gradient set. Re-shimming can offset some of the effects of this mechanism between runs, but not within a run. When viewed from the perspective of your agnostic volume realignment algorithm, thermal drifts appear a lot like slow (real) head movements, e.g. as foam compresses or neck muscles relax. Re-shimming between runs helps with both, but I'm afraid it doesn't do anything within a run. De-trending is usually used to good effect here.

There are doubtless other sources of instability that can manifest as apparent head motion - anything that causes shifts in the on-resonance frequency during an EPI time series will do it - but here I've covered the main mechanisms of concern. Given robust head restraint to mitigate most of the direct head motion mechanisms (except brain pulsations), it seems that the next largest instabilities to tackle are the respiratory motion mechanisms. We have three to work on: residual direct motion through the neck, magnetic susceptibility of the chest, and the possible deflection of the patient bed.

Wednesday, April 12, 2017

"Power plots" of respiratory effects in EPI


This will be brief, a simple demonstration of the sort of features visible in a "Power plot" of an EPI time series. The goal is to emphasize that chest motion produces apparent head motion effects in typical analyses. Here the subject's head was held very firmly in the 32ch coil of my Siemens Trio using a custom printed head case. See the posts from October last year for more details. In this test the subject inhaled to near maximum and exhaled immediately, repeating the procedure every 30 seconds or so in a self-paced manner. The subject breathed normally otherwise. Critically, note that no breaths were held.


What we see are two striking features. First, there is banding with a period of approx 30 seconds, and the bright bands correspond with apparent head movement reported as framewise displacement (FD) in the top red trace. (TR is 1700 ms.) Some of this may be real head movement, but a lot arises from chest displacements modulating the magnetic field. This is the feature I want to emphasize. We need to be aware that not all sources of frame-to-frame variation reported by a volume registration (aka motion correction) algorithm are necessarily actual head motion. Last October I showed in a series of simple demonstrations how chest motion produces shearing and translations of EPI signals in a manner consistent with perturbation of magnetic field, rather than head motion per se. It's important for you to distinguish these two phenomena because the volume registration algorithm cannot differentiate them. It does its best to match volumes no matter the source of differences.

The second feature in the plots above I'm not going to get deep into here. It's for another day. But it's pretty hard to miss the dark bands that follow tens of seconds after each bright band. Notice that the dark bands don't tend to coincide with increased FD. That is, the origin of the dark bands isn't actual or apparent head motion but something else. They come from changes in BOLD signal as the arterial CO2 changes. This is the part of the "physiologic noise" that people try to model with things like RETROICOR and RVT, or from end-tidal CO2 measurements. Here, the perturbation in BOLD signal is driven by the strange breathing task, but it's not motion or motion-like. It's real physiology in the brain.

That's all for now! More posts on this stuff in the coming weeks.