Education, tips and tricks to help you conduct better fMRI experiments.
Sure, you can try to fix it during data processing, but you're usually better off fixing the acquisition!
Showing posts with label Physiology. Show all posts

Thursday, June 26, 2025

Single slice EPI to visualize brain pulsations


We talk a lot about head motion in fMRI. As much as head motion can be limiting, it’s also important to remember that there is real brain motion, too, distinct from whatever the head might be doing. And whereas printed head cases or bite bars might reduce head motion to a large extent, the real brain motion occurs inside the skull in a way that is inaccessible to anything we can do during data collection. (In principle, one could gate acquisitions to the cardiac cycle, but this would invoke its own set of complications.) Instead, we are forced to deal with real brain motion as best we can during post-processing. The problem here is that our image processing tools usually work at the voxel level, leaving any sub-voxel motion unaddressed. 

A few years ago I was involved with a project to assess vibrations measurable on the skull. To relate what could be measured outside with what was happening inside the head, we used a single slice EPI sequence collected at a TR of 40 ms; a frame rate of 25 images per second. At this speed, all the dynamics produced by the arterial blood pressure wave - the mechanical force which propels the blood from the aorta - are visible in quite spectacular fashion right across the brain. Here are a couple of example scans:


Apart from the very obvious fluctuations in the lateral ventricles, note how the CSF in sulci also fluctuates with each heart beat. If you look very closely you’ll be able to see the brain tissue deforming, too. Several vessels, mostly veins, are visible. Pulsation in the superior sagittal sinus is especially prominent in the sagittal scan. In the transverse scan there are also large changes in the overall image intensity every few heart beats, and this is almost certainly due to breathing (which we didn't track).

Note that this type of contrast isn’t replicated precisely in your fMRI scans. Use of a single slice with a relatively high excitation flip angle (30 degrees) relative to the short TR (40 ms) means that we have considerable within slice and inflow T1 weighting, in addition to the T2* changes you’re used to thinking about for BOLD. But some scaled down version of these apparent T1 changes are in your fMRI data, especially if you’re not in the habit of using a small flip angle. (See this post and Gonzales-Castillo et al. (2013) for more information on setting the flip angle to minimize motion effects via image contrast.)

Perhaps more importantly, think about what’s happening at the tissue level. Even if we somehow magic away all the CSF and large vessel fluctuations, we’re still left with considerable non-linear movement of the brain tissue itself. This motion is greatest at the base of the brain, but displacement and shearing of many cortical areas can be seen in the above cine loops with the naked eye. Maybe ponder real brain motion the next time you click the button to apply a motion-correction or physiological noise reduction step in your processing pipeline. How well do you think your “motion correction” steps are tackling these low-level perturbations? Don’t forget they’re also working simultaneously on the (usually larger) displacements and rotations from real head motion and pseudo-motion produced by respiration (i.e. chest movements perturbing the magnetic field across the head). 


PS If you want to see more dynamic images of brain motion, check out the motion-amplified scans developed by Samantha Holdsworth's group: 2D, 3D, quantitative 3D. Not fMRI but still powerful reminders that the entire brain is moving almost all the time.

Wednesday, June 19, 2024

Functional connectivity, ha ha ha.


If you do resting-state fMRI and you do any sort of functional connectivity analysis, you should probably read this new paper from Blaise Frederick:

https://www.nature.com/articles/s41562-024-01908-6

I've been banging the drum on systemic LFOs for some time. Here's another example of how not properly thinking through the physiology of the entire human can produce misleading changes in so-called FC in the fMRI data. That said, I don't think Blaise has the full story here, either. For one thing, the big dips in his Fig 1b suggest that something is being partially offset with the on-resonance adjustment that is conducted automatically at the start of each EPI time series, so I have a residual concern that there are magnetic susceptibility effects contributing here somewhere. (Perhaps the magnetic susceptibility effects are what's left to drift higher after RIPTiDe correction, as in Fig 6b, for example.) The point is that not having independent measures of things like arousal, or proper models of physiologic noise components like sLFOs, or a full understanding of what's happening in the scanner hardware (including head support) during the experiment can lead to an assumption that things are neural when there are better explanations available. 

---

Link added on 6/23/2024: Blaise Frederick discussing systemic LFOs on "Coffee Break!"


Sunday, January 13, 2019

Arterial carbon dioxide as an endogenous "contrast agent" for blood flow imaging


I nearly called this post Low Frequency Oscillations - part III since it closely follows the subject material I covered in the last two posts. But this is a slight tangent. Following the maxim "One scientist's noise is another scientist's signal," in this post I want to look at the utility of systemic LFO to map blood flow dynamics, an idea that was suggested in 2013 by Lv et al. based on the earlier work from Tong & Frederick that I reviewed last post. There is also at least one review of this topic, from 2017.

Let me first recap the last post. There is sufficient evidence, supported by multiple direct and indirect lines of inquiry, to suggest a blood-borne contrast mechanism that produces a prominent fluctuation at around 0.1 Hz in resting-state fMRI data. (Here, I assume a standard T₂*-weighted EPI acquisition for the resting-state fMRI data.) Furthermore, the same fluctuation can be found anywhere in the body. That is, the fluctuation is truly systemic. The best explanation to date is that non-stationary arterial CO₂ concentration, brought about by variations in breathing rate and/or depth, produces changes in arterial tone by virtue of the sensitivity of smooth muscle walls to the CO₂ dissolved in arterial blood. I shall assume such a mechanism throughout this post, while noting that the actual mechanism is less critical here than whether there is some utility to be exploited.

In the title I put "contrast agent" in quotes. That's because the CO₂ isn't the actual contrast agent, but a modulator of contrast changes. When the smooth muscle walls of an artery sense a changing CO₂ concentration, they either expand or contract locally, modulating the blood flow through that vessel. In the brain, a change in a blood vessel's diameter causes a concomitant change cerebral blood volume (CBV), hence cerebral blood flow (CBF). There may be a local change in magnetic susceptibility corresponding to the altered CBV in the arteries and capillaries. But the altered CBF will definitely produce the well-known change in magnetic susceptibility in and around the venous blood that can be detected downstream of the tissue, i.e. the standard BOLD effect. The actual contrast we detect is by virtue of changes in T₂* (for gradient echo EPI), plus the possibility of some flow weighting of the arterial blood depending on the combination of flip angle (FA) and repetition time (TR) being used. As a shorthand, however, I shall refer to arterial CO₂ as the endogenous contrast agent because whenever an artery senses a change in CO₂ concentration, there will be a concomitant change in vessel tone, and we will see a cascade of signal changes arising from it. (See Note 1 for some fun with acronyms!)


Time shift analysis

Most published studies attempting to exploit systemic LFO have used fixed time shifts, or lags, in their analysis. You just need a few minutes' worth of BOLD fMRI data, usually resting state (task-free). The analysis is then conceptually straightforward:
  1. Define a reference, or "seed," time course;
  2. Perform cross correlations between the "seed" and the time course of each voxel, using a set of time shifts that typically spans a range of 15-20 seconds (based on the expected brain hemodynamics);
  3. Determine for each voxel which time shift gives the largest cross correlation value, and plot that value (the delay, in seconds) to produce a lag map.

There are experimental variables, naturally. The duration of the BOLD time series varies, but most studies to date have used the 5-8 min acquisition that's common for resting-state connectivity. Some studies filter the data before starting the analysis. Different studies also tend to choose different seeds. There are pros and cons for each seed category that I assess in the next section. Time shifts are usually increments of TR, e.g. the lag range might be over +/- 5 TRs for a common TR of 2 sec. And, in producing the final lag maps, some studies apply acceptance criteria to reject low correlations.

Let's look at an example time shift analysis, from Siegel et al. (2016). The raw data were filtered with a pass-band of 0.009 - 0.09 Hz. For cross correlations, they used as their seed time course the global gray matter (GM) signal. Cross correlations were computed voxel-by-voxel for nine delays of TR = 2 sec increments, covering +/- 8 sec, followed by interpolation over the lag range. The time shift corresponding to the maximum cross correlation was assigned that voxel's lag value in the final map, as shown here:

Fig. 1 from Siegel et al. (2016).

Thursday, June 14, 2018

FMRI data modulators 3: Low frequency oscillations - part II


In the previous post, I laid out four broad categories of low frequency oscillation (LFO) that arise in fMRI data. The first three categories are mentioned quite often in fMRI literature, with aliasing of respiratory and cardiac pulsations being the best known of all “physiological noise” components. In this post, I am going to dig into the fourth category: blood-borne agents. Specifically, I want to review the evidence and investigate the possibility that non-stationary arterial CO₂ might be producing an LFO that is at least as important as aliased mechanical effects. At first blush, this is unsurprising. We all claim to know CO₂ is a potent vasodilator, so we can think of CO₂ in blood as a sort of changing contrast agent that perturbs the arterial diameter – producing changes in cerebral blood volume - whenever the arterial CO₂ concentration departs from steady state.

Why would arterial CO₂ fluctuate? Why isn't it constant? Simply put, we don't breathe perfectly uniformly. If you monitor your own breathing you’ll notice all sorts of pauses and changes of pace. Much of it depends on what you’re doing or thinking about, which of course gets right to the heart of the potential for fluctuations in CO to be a confound for fMRI.

I had hoped to begin this post with a review of CO transport in the blood, and from there to relay what I’ve found on the biochemical mechanism(s) underlying vasodilation caused by CO. But after several weeks of searching and background reading, I still don’t have sufficient understanding of the biochemistry to give you a concise overview. The CO transport mechanisms are quite well understood, it seems. But how a change in one or more components of CO in arterial blood produces changes in the arterial smooth muscle wall, that is a more complicated story. For the purposes of this post, then, we shall have to content ourselves with the idea that CO is, indeed, a potent vasodilator. The detailed biochemistry will have to wait for a later post. For those of you who simply can’t wait, I suggest you read the review articles given in Note 1. They aren’t aimed at an fMRI audience, so unless you are a biochemist or physiologist, you may not get the sort of intuitive understanding that I have been searching for.


First indications that arterial CO might be an important source of LFO in fMRI data

The effects of respiration on BOLD data were recognized in the mid-nineties as an important consideration for fMRI experiments. By the late nineties, several groups began to investigate the effects of intentionally held breaths on BOLD signal dynamics, using as their basis the phenomenon of arterial CO as a vasodilator. Other groups (e.g. Mitra et al., 1997) observed low frequency fluctuations in BOLD data that suggested a vasomotor origin, or found fluctuations in cerebral blood flow (CBF) measured by non-MR means (e.g. Obrig et al., 2000). It wasn’t until 2004, however, that Wise et al. showed definitively how slow variations of arterial CO concentration were related to, and likely driving, low frequency variations in BOLD time series data:
PETCO-related BOLD signal fluctuations showed regional differences across the grey matter, suggesting variability of the responsiveness to carbon dioxide at rest.”
“Significant PETCO-correlated fluctuations in [middle cerebral artery] MCA blood velocity were observed with a lag of 6.3 +/- 1.2 s (mean +/- standard error) with respect to PETCO changes.”

The spatial-temporal dynamics observed by Wise et al. certainly fit a blood-borne agent. That is, we should expect lag variations dependent on the total arterial distance between the heart and the tissue of interest; in their case, the MCA.

Saturday, March 24, 2018

FMRI data modulators 3: Low frequency oscillations - part I


Low frequency oscillations (LFOs) may be one of the the most important sources of signal variance for resting-state fMRI. Consider this quote from a recent paper by Tong & Frederick:
"we found that the effects of pLFOs [physiological LFOs] dominated many prominent ICA components, which suggests that, contrary to the popular belief that aliased cardiac and respiration signals are the main physiological noise source in BOLD fMRI, pLFOs may be the most influential physiological signals. Understanding and measuring these pLFOs are important for denoising and accurately modeling BOLD signals."

If true, it's strange that LFOs aren't higher on many lists of problems in fMRI. They seem to be an afterthought, if thought about at all. I suspect that nomenclature may be partly responsible for much of the oversight. A lot of different processes end up in the bucket labeled "LFO." The term is used differently in different contexts, with the context most often defined by the methodology under consideration. Folks using laser Doppler flow cytometry may be referring to something quite different than fMRI folks. Or not. Which rather makes my point. In this post I shall try to sort the contents of the LFO bucket, and in at least one later post, I shall dig more deeply into "systemic LFOs." These are the LFOs having truly physiological origin; where the adjective is used according to its physiological definition:


The description I pulled up from the Google dictionary tells us the essential nature of systemic LFOs: at least some of them are likely to involve the blood gases. And I'll give you a clue to keep you interested. It's the CO component that may end up being most relevant to us.


What exactly do we mean by low frequency oscillations anyway?

"Low frequency" generally refers to fluctuations in fMRI signal that arise, apparently spontaneously, with a frequency of around 0.1 Hz. The precise range of frequencies isn't of critical importance for this post, but it's common to find a bandwidth of 0.05 - 0.15 Hz under discussion in the LFO literature. I'll just say ~ 0.1 Hz and move on. I added "apparently spontaneously" as a caveat because some of mechanisms aren't all that spontaneous, it turns out.

For the purposes of this post we're talking about variations in BOLD signal intensity in a time series with a variation of ~ 0.1 Hz. There may be other brain processes that oscillate at low frequencies, such as electrical activity, but here I am specifically concerned with processes that can leave an imprint on a BOLD-contrasted time series. Thus, neurovascular coupling resulting in LFO is relevant, whereas low frequency brain electrical activity per se is not, because the associated magnetic fields (in the nanotesla range, implied from MEG) are far too small to matter.

Is LFO the lowest modulation of interest? No. There are physiological perturbations that arise at even lower frequencies. These are often termed very low frequency oscillations (VLFOs) because, well, we scientists are an imaginative bunch. These VLFOs generally happen below about 0.05 Hz. The biological processes that fluctuate once or twice a minute may well be related to the LFOs that are the focus here, but I am going to leave them for another day.

Saturday, December 9, 2017

FMRI data modulators 2: Blood pressure


If you conduct fMRI experiments then you'll have at least a basic understanding of the cascade of events that we term neurovascular coupling. When the neuronal firing rate increases in a patch of brain tissue, there is a transient, local increase of the cerebral blood flow (CBF). The oxygen utilization remains about the same, however. This produces a mismatch in the rate of oxygen delivered compared to the rate of oxygen consumption. The CBF goes up a lot while the oxygenation usage increases only slightly. Hence, there is a decrease in the concentration of deoxygenated hemoglobin in the veins draining the neural tissue region, in turn reducing the degree of paramagnetism of these veins that yields a signal increase in a T2*-weighted image. The essential point is that it's blood delivery - changes in CBF - that provides the main impetus for BOLD contrast.


How is blood pressure related to CBF?

The average CBF in a normal adult brain is typically maintained at around 50 ml of blood per 100 g of brain tissue per minute (50 ml/100g/min). The average number, while useful, represents considerable spatial and temporal heterogeneity across the brain. The typical CBF in gray matter is approximately double that in white matter, and there is significant variation across each tissue type arising from tight metabolic coupling. (See Note 1.)

At the local level, blood delivery to tissue is controlled by smooth muscles on the walls of arterioles and capillaries. The degree of vessel dilation, relative to that vessel's maximum possible dilation, is called its tone - the vascular tone. There are mechanisms to expand or constrict the smooth muscles, changing the local blood flow in order to maintain the tight local coupling of CBF to metabolic demand while protecting the vasculature and the tissue against damage that might arise with systemic changes in the blood supply from non-neural mechanisms. The totality of these processes is referred to as cerebral autoregulation. More on the non-neural factors later.

This is all very well, but there is something important missing from this picture. We have neglected to consider so far that the force of blood pumped out of the heart creates a pressure gradient across the arteries and the veins, with the tissue providing a resistance in between. It's this pressure gradient that causes the blood to flow. In fact, simple electrical circuits are a convenient model here. For those of you more familiar with electron flow than blood flow, we can think of the CBF as an analog of electrical current, the pressure difference as a voltage and, naturally enough, the tissue's resistance to flow mimics an electrical resistance. Thus we get:

CBF = CPP / CVR

where CPP is the cerebral perfusion pressure, the net pressure gradient - the driving force - that generates perfusion of brain tissue, and CVR is the cerebrovascular resistance. The CVR is the sum total of all mechanisms exerting control over the vascular tone at a particular location. It isn't easily estimated without detailed knowledge of the processes that might be active. The neurovascular coupling pathways contribute to CVR, for example.

Thursday, October 5, 2017

FMRI data modulators 1: Heart rate


It's 2027 and you are preparing to run a new fMRI experiment. Since 2023 you've been working on a custom 7 T scanner that was developed to mitigate several issues which plagued the early decades of fMRI. Long gone are the thermal shim and gradient drifts of yesteryear, courtesy of an intelligent water cooling system that maintains all hardware at near constant temperature even when the scanner is run flat out. Your scanner also has a custom gradient set with active shielding over the subject's chest. It means the rise time of the gradients is limited only by peripheral nerve stimulation in the subject's face and scalp, not by the possibility of causing fibrillation in the heart. You can use a slew rate four times faster than on the scanner you had back in 2017, meaning distortions of your 1 mm cubic voxels, acquired over the entire brain (including cerebellum!) are minuscule. What's more, your images no longer suffer from translations and shearing because of the subject's chest motion. Your scanner tracks the magnetic field across the subject's head and actively compensates for the effects of breathing. When used with the comfortable head restraint system that mates directly to the receiver electronics - which itself monitors changes in coil loading to ensure the 128-channel array coil doesn't impart its own bias field onto your images - you have finally got to the point in your career where you no longer worry about head motion.

Almost. There's no doubt the hardware of the future could be remarkable compared to today's scanners. Our current scanners are clinical products being used for science rather than scientific instruments per se. However, even if we were to supersede BOLD with a non-vascular "neural current" contrast mechanism, the basic physics of MRI suggests that we will have to consider real brain motion in the future, just as we do today. Perhaps we can differentiate this brain motion from the contrast of interest using multiple echoes or some other trick, but I don't envisage being able to ignore the brain's vasculature entirely, whereas I am optimistic that improved scanner engineering might one day ameliorate the mechanical and thermal instabilities. Real brain motion and regional variation in pulsatility are likely to be biological limits that must be accommodated rather than eliminated.


What are the mechanisms of concern?

We can restrain the subject's skull quite well using a bite bar or a printed case. Inside the skull, however, is a gelatinous blob of brain, highly vascularized, under a small positive pressure (the intracranial pressure, ICP). The brain will tend to throb with the heart rate (HR) as blood is pumped into the brain through the arteries. The arterial network is spatially heterogeneous and so we see heterogeneous motion across the brain. The arteries enter at the base of the brain, causing the entire midbrain and brainstem to move relative to the cortex. Locally, tissue close to large vessels can demonstrate greater displacements than tissue just a few millimeters away. These regional perturbations will arise with a range of delays relative to the cardiac output, as the blood pressure wave migrates from the heart. The greater the distance from the heart, the longer the lag. We'll see in a later post how this phenomenon can be used to estimate blood pressure.

There are also cardiac driven pulsations in the cerebrospinal fluid (CSF). These can be visualized as small displacements of tissue adjacent to the ventricular system as well as in sulci of the cortex. Pulsation in CSF and the changing velocity of blood in large vessels also tend to produce image contrast changes. This isn't real brain motion, of course, but it is a consideration if one is attempting to use local signal properties or overall image contrast to ameliorate regional pulsatility. A new paper by Viessmann et al. provides a timely investigation of the issues, concluding that fluctuations in partial volumes of blood and CSF/interstitial fluid give rise to local T2* changes over the cardiac cycle. So the final complexity is again temporal. The cardiac cycle is itself non-stationary, leading to dynamic changes in the locations of blood, CSF and brain tissue.

Tuesday, August 22, 2017

Fluctuations and biases in fMRI data


In my last post I summarized the main routes by which different forms of actual or apparent motion can influence fMRI data. In the next few posts, I want to dig a little deeper into non-neural causes of variation in fMRI data. I am particularly interested in capturing information on the state of the subject at the time of the fMRI experiment. What else can be measured, and why might we consider measuring it? Brains don't float in free space. They have these clever life support systems called bodies. While most neuroimagers reluctantly accept that these body things are useful for providing glucose and oxygen to the brain via the blood, bodies can also produce misleading signatures in fMRI data. My objective in this series of posts is to investigate the main mechanisms giving rise to fluctuations and biases in fMRI data, then consider ways other independent measurements might inform the fMRI results.

Many causes, much complexity

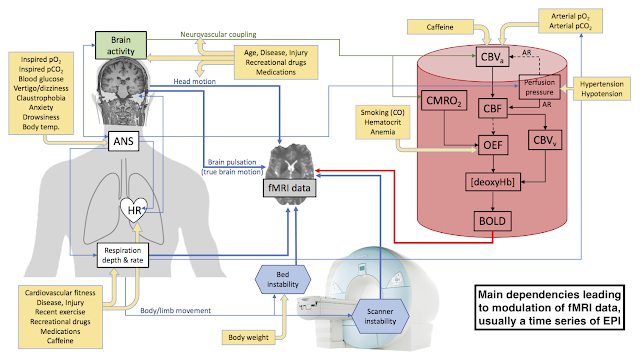
There are three broad categories of fluctuations or biases imprinted in the fMRI data. I've tried to depict them in Figure 1. At top-right, in a cartoon red blood vessel, is the cascade of physiological events leading to BOLD contrast. Next, on the left, there are perturbations arising from the subject's body. Some of these are direct effects, like head motion, and some are propagated via modulation of the same physiological parameters that give rise to BOLD. Breathing is a good example of the latter. A change in breathing depth or frequency can change the arterial concentration of CO2, leading to non-neural BOLD changes. Furthermore, the breathing rate is intricately tied to the heart rate, via the vagus nerve, and so we can also expect altered brain pulsation. In the final category, depicted in my figure as scanner-based mechanisms at the bottom, we have experimental imperfections. In the last group are things that could be reduced or eliminated in principle, such as thermal drift in the gradients, wobbly patient beds, and resonance frequency shifts across the head arising from changing magnetic susceptibility of the chest during breathing. The thin blue lines connecting the different parts of the figure are supposed to show the main influences, with arrowheads to illustrate the directionality.

(Click image to enlarge.)

Figure 1. Major routes of modulation in time series data in an fMRI experiment. The flow chart in the depiction of a blood vessel, in red, is based on a figure from Krainik et al. 2013 and shows the main events leading to BOLD via neurovascular coupling. Main body-based mechanisms originate on the left, and scanner-based experimental imperfections are depicted on the bottom. All mechanisms ultimately feed into the fMRI data, depicted at center. Yellow boxes contain some of the main modulators of mechanisms that can produce either fluctuations or systematic biases in fMRI data.

Abbreviations: ANS - autonomic nervous system, HR - heart rate, CBVa - arterial cerebral blood volume, CBVv - venous cerebral blood volume, CMRO2 - cerebral metabolic rate of oxygen utilization, CBF - cerebral blood flow, OEF - oxygen extraction fraction, deoxyHb - deoxyhemoglobin, AR - autoregulation, pO2 - partial pressure of oxygen (O2 tension), pCO2 - partial pressure of carbon dioxide (CO2 tension).


As if that wasn't already a lot of complexity, I'm afraid there's more. In the yellow boxes of Figure 1 are some of the main modulators of the underlying mechanisms responsible for perturbing fMRI data. These modulators are usually considered to be confounds to the main experimental objective. I posted a list of them a few years ago. Caffeine is probably the best known. It modulates both the arterial cerebral blood volume (CBVa) as well as the heart rate (HR). We already saw that HR and breathing are coupled, so this produces a third possible mechanism for caffeine to affect fMRI data. There's also an obvious missing mechanism: its neural effects. Some direct neural modulators are summarized in Figure 2, placed in their own figure simply to make this a tractable project. I'll be going back to reconsider any direct neural effects at the end of the series, to make sure I've not skipped anything useful, but my main emphasis is the contents of Figure 1.

Figure 2. Potential modulators of neural activity during an fMRI experiment.


Measuring the modulators

There are about a dozen mechanisms leading to fluctuations in fMRI data. Note that some paths depicted in Figure 1 may contain multiple discrete mechanisms. The figure would be far too cluttered if every mechanism was depicted. Take head motion. It could be foam compressing through no fault of the subject, or it could be the subject fidgeting, or apparent head motion arising from the sensitivity of the EPI acquisition to off-resonance effects (for which there are at least two main contributions: thermal drift in the scanner and chest motion in the subject). I tried to estimate how many combinations are represented in Figure 1 but quickly gave up. It's several dozen. I'm not sure that knowing the number helps us. Clearly, it's an omelette.

So, what can we do about it? Well, there are only so many things one can measure before, during or after an MRI scan, so we should probably start there. In the first set of posts in this series I'll look at non-MRI measures that can be performed during fMRI data acquisition, to track moment to moment changes in some of the parameters of Figure 1. These will include:

Then, in the next set of posts I'll shift to assessing ancillary MRI measurements that can inform an fMRI experiment, such as:
  • Anatomical scans
  • Baseline CBF
  • Blood oxygenation
  • Cerebrovascular reactivity
  • Calibrated fMRI (which is actually a slightly different way of doing the fMRI experiment, but requires some ancillary steps)

Finally, I'll consider informative, non-MRI data you could capture from questionnaires or relatively simple non-invasive testing. With better understanding, I am hoping that more researchers begin to consider physiology as earnestly as they do the domains involving psychology and statistics.

Wednesday, April 12, 2017

"Power plots" of respiratory effects in EPI


This will be brief, a simple demonstration of the sort of features visible in a "Power plot" of an EPI time series. The goal is to emphasize that chest motion produces apparent head motion effects in typical analyses. Here the subject's head was held very firmly in the 32ch coil of my Siemens Trio using a custom printed head case. See the posts from October last year for more details. In this test the subject inhaled to near maximum and exhaled immediately, repeating the procedure every 30 seconds or so in a self-paced manner. The subject breathed normally otherwise. Critically, note that no breaths were held.


What we see are two striking features. First, there is banding with a period of approx 30 seconds, and the bright bands correspond with apparent head movement reported as framewise displacement (FD) in the top red trace. (TR is 1700 ms.) Some of this may be real head movement, but a lot arises from chest displacements modulating the magnetic field. This is the feature I want to emphasize. We need to be aware that not all sources of frame-to-frame variation reported by a volume registration (aka motion correction) algorithm are necessarily actual head motion. Last October I showed in a series of simple demonstrations how chest motion produces shearing and translations of EPI signals in a manner consistent with perturbation of magnetic field, rather than head motion per se. It's important for you to distinguish these two phenomena because the volume registration algorithm cannot differentiate them. It does its best to match volumes no matter the source of differences.

The second feature in the plots above I'm not going to get deep into here. It's for another day. But it's pretty hard to miss the dark bands that follow tens of seconds after each bright band. Notice that the dark bands don't tend to coincide with increased FD. That is, the origin of the dark bands isn't actual or apparent head motion but something else. They come from changes in BOLD signal as the arterial CO2 changes. This is the part of the "physiologic noise" that people try to model with things like RETROICOR and RVT, or from end-tidal CO2 measurements. Here, the perturbation in BOLD signal is driven by the strange breathing task, but it's not motion or motion-like. It's real physiology in the brain.

That's all for now! More posts on this stuff in the coming weeks.


Monday, December 8, 2014

Concomitant physiologic changes as potential confounds for BOLD-based fMRI: a checklist


Many thanks for all the feedback on the draft version of this post.

Main updates since the draft:
  • Added DRIFTER to the list of de-noising methods
  • Added a reference for sex differences in hematocrit and the effects on BOLD
  • Added several medication classes, including statins, sedatives & anti-depressants
  • Added a few dietary supplements, under Food

Please do continue to let me know about errors and omissions, especially new papers that get published. I'll gladly do future updates to this post.


UPDATES:

(Since this post release on 8th Dec, 2014.) 

17th Dec 2014: Update for cortisol, highlighted in yellow.
18th Dec 2014: Update for methylphenidate, atomoxetine & amphetamine, highlighted in orange.
19th Dec 2014: Update for oxytocin, highlighted in turquoise.
13th Jan 2015: Update for effects of the scanner itself, highlighted in green.
27th Feb 2015: Added a new reference, hematocrit effects on resting-state fMRI.
27th May 2016: Added new references on altitude, sleep, pharmacological fMRI (with morphine & alcohol).
1st Feb & 2nd Mar 2017: Added new references for flavonoids in foods, highlighted in red.
23rd May 2017: Added a new reference for the effect of carbon monoxide on BOLD.
______________________


A recent conversation on Twitter led to the suggestion that someone compile a list of physiological effects of concern for BOLD. That is, a list of potentially confounding physiological changes that could arise sympathetically in an fMRI experiment, such as altered heart rate due to the stress of a task, or that could exist as a systematic difference between groups. What follows is the result of a PubMed literature search (mostly just the abstracts) where I have tried to identify either recent review articles or original research that can be used as starting points for learning more about candidate effects. Hopefully you can then determine whether a particular factor might be of concern for your experiment.

This is definitely not a comprehensive list of all literature pertaining to all potential physiological confounds in fMRI, and I apologize if your very important contribution didn't make it into the post. Also, please note that I am not a physiologist so if I go seriously off piste in interpreting the literature, please forgive me and then correct my course. I would like to hear from you (comments below, or via Twitter) if I have omitted critical references or effects from the list, or if I have misinterpreted something. As far as possible I've tried to restrict the review to work in humans unless there was nothing appropriate, in which case I've included some animal studies if I think they are directly relevant. I'll try to keep this post up-to-date as new studies come out and as people let me know about papers I've missed.

A final caution before we begin. It occurs to me that some people will take this list as (further) proof that all fMRI experiments are hopelessly flawed and will use it as ammunition. At the other extreme there will be people who see this list as baseless scare-mongering. How you use the list is entirely up to you, but my intent is to provide cautious fMRI scientists with a mechanism to (re)consider potential physiologic confounds in their experiments, and perhaps stimulate the collection of parallel data that might add power to those experiments.


Getting into BOLD physiology


There are some good recent articles that introduce the physiological artifacts of prime concern. Tom Liu has reviewed neurovascular factors in resting-state functional MRI and shows how detectable BOLD signals arise from physiological changes in the first place. Kevin Murphy et al. then review some of the most common confounds in resting-state fMRI and cover a few ways these spurious signal changes can be characterized and even removed from data. Finally, Dan Handwerker et al. consider some of the factors causing hemodynamic variations within and, in particular, between subjects.

Once you start really looking into this stuff it can be hard not to get despondent. Think of the large number of potential manipulations as opportunities, not obstacles! Perhaps let The Magnetic Fields get you in the mood with their song, "I don't like your (vascular) tone." Then read on. It's a long list.

Thursday, October 30, 2014

Concomitant physiological changes as potential confounds for BOLD-based fMRI: a (draft) checklist

**Please let me know of errors or omissions!**

This post is a work-in-progress. It will be updated based on feedback. I will remove (draft) from the title when I consider this version to be complete.


A recent conversation on Twitter led to the suggestion that someone compile a list of physiological effects of concern for BOLD. That is, a list of potentially confounding physiological changes that could arise sympathetically in an fMRI experiment, such as altered heart rate due to the stress of a task, or that could exist as a systematic difference between groups. What follows is the result of a PubMed literature search (mostly just the abstracts) where I have tried to identify either recent review articles or original research that can be used as starting points for learning more about candidate effects. Hopefully you can then determine whether a particular factor might be of concern for your experiment.

This is definitely not a comprehensive list of all literature pertaining to all potential physiological confounds in fMRI, and I apologize if your very important contribution didn't make it into the post. Also, please note that I am not a physiologist so if I go seriously off piste in interpreting the literature, please forgive me and then correct my course. I would like to hear from you (comments below, or via Twitter) if I have omitted critical references or effects from the list, or if I have misinterpreted something. As far as possible I've tried to restrict the review to work in humans unless there was nothing appropriate, in which case I've included some animal studies if I think they are directly relevant. I'll try to keep this post up-to-date as new studies come out and as people let me know about papers I've missed. As it says at the top, I'll consider this a draft post pending feedback. Subsequent posts will be designated with a version number.

A final caution before we begin. It occurs to me that some people will take this list as (further) proof that all fMRI experiments are hopelessly flawed and will use it as ammunition. At the other extreme there will be people who see this list as baseless scare-mongering. How you use the list is entirely up to you, but my intent is to provide cautious fMRI scientists with a mechanism to (re)consider potential physiologic confounds in their experiments, and perhaps stimulate the collection of parallel data that might add power to those experiments.


Getting into BOLD physiology


There are some good recent articles that introduce the physiological artifacts of prime concern. Tom Liu has reviewed neurovascular factors in resting-state functional MRI and shows how detectable BOLD signals arise from physiological changes in the first place. Kevin Murphy et al. then review some of the most common confounds in resting-state fMRI and cover a few ways these spurious signal changes can be characterized and even removed from data. Finally, Dan Handwerker et al. consider some of the factors causing hemodynamic variations within and, in particular, between subjects

Once you start really looking into this stuff it can be hard not to get despondent. Think of the large number of potential manipulations as opportunities, not obstacles! Perhaps let The Magnetic Fields get you in the mood with their song, "I don't like your (vascular) tone." Then read on. It's a long list.

Tuesday, April 9, 2013

Resting state fMRI confounds

(Thanks to Dave J. Hayes for tweeting the publication of these papers.)

Two new papers provide comprehensive reviews of some of the confounds to the acquisition, processing and interpretation of resting state fMRI data. In the paper, "Resting-state fMRI confounds and cleanup," Murphy, Birn and Bandettini consider in some detail many of the noise sources in rs-fMRI, especially those having a physiologic origin.

In "Overview of potential procedural and participant-related confounds for neuroimaging of the resting state," Duncan and Northoff review the effects that other circumstantial factors, such as the scanner's acoustic noise, subject instructions, subjects' emotional state, and caffeine might have on rs-fMRI studies. Without due consideration, some or all of these factors may inadvertently become experimental variables; the implications for inter-individual differences are considerable. (I've reviewed some of the issues concerning what we can permit subjects to do before and during rs-fMRI in this post.)

While we're on the subject of confounds in rs-fMRI - especially those with a motion component - another confound that motion introduces is a sensitivity to the receive field heterogeneity of the head coil. This problem gets worse the more channels the coil has, because the coil elements get smaller as the number of channels goes up. For an introduction to the issue see this arXiv paper; there will also be simulations of the effect for a 32-channel coil at the ISMRM conference in a couple of weeks' time. (See e-poster, abstract #3352.) The result is that spurious correlations and anti-correlations can result, necessitating some sort of clever sorting or de-noising scheme to distinguish them from "true" brain correlations. I mention it here because there is a common misconception in the field that applying a retrospective motion correction step fixes all motion-related artifacts. It doesn't. Nor does including all of the motion parameters as regressors in a model. Motion has some insidious ways in which it can modulate the MRI signal level, and it is high time that we, as a field, reconsider very carefully what we are doing for motion correction, and why.

Finally, I'll note in passing that slice timing correction may not be a good idea for rs-fMRI. It's been known since the correction was first proposed that it should interact a with a motion correction step. (The two corrections should be applied simultaneously, as one 4D space-time correction rather than a separate 3D space then time correction, or vice versa.) I don't have data to share just yet, but if anyone is wondering whether they should include STC in their rs-fMRI analysis, as they would do for event-related fMRI, then my advice is to skip it until someone can prove to you that it has no unintended consequences. (Demonstration of unintended consequences to follow eventually....)


References:

Resting state fMRI confounds and cleanup. K Murphy, RM Birn and PA Bandettini, NeuroImage Epub.
DOI: 10.1016/j.neuroimage.2013.04.001

Overview of potential procedural and participant-related confounds for neuroimaging of the resting state. NW Duncan and G Northoff, J. Psychiatry Neurosci. 2013, 38(2), 84-96.
PMID: 22964258
DOI: 10.1503/jpn.120059

Tuesday, September 11, 2012

Intense stray (static) magnetic field gradients may affect cognition


Have you ever wondered whether it's appropriate to put a research subject into a dark, confined tube that makes an awful din, whereupon the subject may learn that his brain has some abnormality, and still expect the subject's brain to operate in a state representative of his normal cognition (and not that of a stressed out basket-case)? And what about the bioeffects of the high magnetic field itself, or of the rapidly switched gradients and their induced electric currents in body tissue? To date there has been scant evidence that the action of studying human cognition via an MRI scanner actually modifies that brain function in a manner that might be considered a significant issue for interpretation of fMRI results.

Putting aside the cognitive effects of a loud background noise and claustrophobia, the question remains whether the static and time-varying magnetic fields are modifying brain function in a substantial fashion. There are some well-known side effects of high magnetic fields: vertigo (see Note 1), and a metallic taste are the two phenomena tied directly to presence of, or movement through, a high magnetic field. (See Note 2.) But these effects tend to be mild and/or transitory, as a subject acclimatizes to the magnetic field, and can usually be rendered negligible by taking care not to make rapid head movements in or around the magnet.

A colleague forwarded to me yesterday a paper from a Dutch group (van Nierop et al., "Effects of magnetic stray fields from a 7 tesla MRI scanner on neurocognition: a double-blind randomized crossover study." Occup. Environ. Med. 2012 Epub) that investigates the effects of head movements in the intense stray field region of a 7 T magnet. So, first of all, some good news: if you're doing fMRI at 1.5 or 3 T and you're not in the habit of asking your subjects to thrash their heads around wildly at the mouth of the magnet or once inside the magnet bore, then so far as is known today you're in the clear. The effects reported in this paper pertain specifically to head movement in the really intense gradients that comprise the stray magnetic field around the outside of a passively shielded 7 T magnet. (The iron shield is outside the magnet, leaving considerable gradients in the vicinity of the magnet when compared to the actively shielded 1.5 and 3 T magnets most of us have nowadays.)

And with that preamble let's look at the summary of the paper:


OBJECTIVE:  This study characterises neurocognitive domains that are affected by movement-induced time-varying magnetic fields (TVMF) within a static magnetic stray field (SMF) of a 7 Tesla (T) MRI scanner.

METHODS:  Using a double-blind randomised crossover design, 31 healthy volunteers were tested in a sham (0 T), low (0.5 T) and high (1.0 T) SMF exposure condition. Standardised head movements were made before every neurocognitive task to induce TVMF.

RESULTS:  Of the six tested neurocognitive domains, we demonstrated that attention and concentration were negatively affected when exposed to TVMF within an SMF (varying from 5.0% to 21.1% per Tesla exposure, p<0.05), particular in situations were high working memory performance was required. In addition, visuospatial orientation was affected after exposure (46.7% per Tesla exposure, p=0.05).

CONCLUSION:  Neurocognitive functioning is modulated when exposed to movement-induced TVMF within an SMF of a 7 T MRI scanner. Domains that were affected include attention/concentration and visuospatial orientation. Further studies are needed to better understand the mechanisms and possible practical safety and health implications of these acute neurocognitive effects.


Okay, so let's make sure we're clear that although the test magnetic field strengths mentioned are 0.5 and 1.0 T, this refers to two heterogeneous regions of a stray magnetic field on the outside of a 7 T magnet:


Tuesday, October 11, 2011

Light relief (to buy me time).... This year's IgNobel in Medicine

Anyone who has ever experienced an fMRI scan knows two things about the effects of the method on a subject: (1) it's soporific, and (2) like a long car journey, you don't need to pee until five minutes after you've started. So this year's IgNobel Prize in Medicine, awarded jointly to two groups, caught my attention. Their work shows how the need to urinate can affect performance on some simple mental tests - just the sort of tests that we use in our fMRI experiments.

Implications for fMRI?

An enjoyable summary of the winning researchers' work is available on this Scientific American blog. According to this summary (Yeah, I haven't got around to reading the papers themselves yet. I'm training to be a mainstream science journalist ;-), needing to pee could have your subjects performing better (yes, better) on delayed gratification tasks, but worse on cognitive tasks. I take these results at face value - I have to, I've not read the papers - but I do want to think a little more about the implications for fMRI studies. It's hard enough keeping people awake, let alone motivated to do a task. And as for providing *additional* motivation for a task... The mind boggles!

"I feel the need, the need to pee!"

So, short of rejecting subjects who rush to the toilet the moment they get out of the scanner, what else could we do to control for the effects? Perhaps we could insist that subjects must be able to sit in a waiting room for 20 minutes post-scan - no pee - and only then opt to retain their scan data.

What else might produce a similar effects in subjects? General discomfort? You have to wonder, given the "need-to-pee" effect, whether a subject's general state of (un)happiness in the scanner might well be interfering with his mental performance. If so, having pressure points in a subject's lower back or whatever could have him significantly altering his task ability.

Alternatively, perhaps the need to pee and general discomfort merely increases a subject's propensity to move. We all know that this is one of the Stages of Having to Pee:


So perhaps this amusing research has some important ramifications for fMRI studies after all. As with so many other state factors - caffeine use, stress, menstrual cycle, etc. - it could just be another in a long litany of issues that contribute to our relatively poor inter-subject variability. You know my feeling on the matter: if you can control for it, control it. And if you can't control for it but you can measure it, MEASURE IT! Would it really be the end of the world if you were to ask your subject to rate her "need to pee" as she exits the scanner? How amusing would it be to see your effect disappear having  regressed out the "need to pee" score?


PS I really will have a last post on EPI k-space along very soon! I promise!

Friday, August 5, 2011

Lessons from epidemiology

Ben Goldacre, psychiatrist, occasional fMRIer and critic of rubbish medical research over at BadScience.net, has produced a radio documentary that covers many of the pitfalls of modern medical science:

Science: From Cradle to Grave

It's aimed at a general audience but there are important reminders for us in fMRI-land.

Confounds abound

Epidemiology is a lot like fMRI when it comes to discriminating correlation from causation. As with many areas of research using human subjects, there are usually limits to the factors that can be controlled between groups, or even across time for an individual subject.

But there are often some simple things that we can measure - like heart and respiration rates during fMRI - and thus control for. Surely we should be measuring (and ideally controlling for) as many parameters as we can get our hands on, especially when the time and expense are comparatively minor. Get as much data as you can!

Resting state fMRI: a motion confound in connectivity studies?

Neuroskeptic has done us a favor and covered a recently accepted paper from Randy Buckner's lab concerning the role of motion when determining connectivity from resting state fMRI. Not only was the amount of motion found to differ systematically between male and female subjects, but this systematic difference was preserved across sessions, suggesting that it is a stable trait. The implications for group studies are discussed in the paper, and Neuroskeptic adds further perspective. It's a warning that all resting state fMRIers should heed.

Non-neural physiology.... again

There are some important limitations to consider, however. While ventricular and white matter regions were used as ways to remove some effects of heart rate and motion, the study did not acquire breathing or heart rate data and so the authors were unable to perform the more advanced BOLD-based model corrections developed by Rasmus Birn and Catie Chang (references below). Instead, they followed what might be considered the "typical" post-processing steps, including global mean signal removal. The methods are fine, my point is to highlight the limitations of the "typical" processing stream in the absence of independent physiological data.

So, could the gender differences be explained with improved physiological corrections? What about the motion correction methods in current use: might they not be up to the job we give them? We'll have to wait for further studies to find out. In the mean time, surely it only makes sense to acquire physiological data with resting state fMRI - heart rate and respiration at the very least, although there are suggestions that time course blood pressure might also be useful - and to try to explain as many confounds as possible before concluding there's a group difference due to brain activity.


References for physiological corrections:

Birn et al., Neuroimage 31: 1536 –1548, 2006.
Birn et al., Neuroimage 40:  644-654, 2008.
Chang & Glover, Neuroimage 47: 1381–1393, 2009. Also 1448 –1459 in the same issue.

Monday, June 13, 2011

Discriminate equally when recruiting subjects

Inclusion and exclusion criteria possibly don't get the scrutiny in fMRI studies that they should. After all, who reports the complete criteria in the methods sections of articles? At best we get headline exclusions. Without the full questionnaires we, as readers (and reviewers), must trust that no biases were introduced accidentally. Yet, like subtle parameter (mis)settings on the scanner, precisely how experimental and control groups are established is going to have profound effects on your results. They'd better!

A study included in Neuroskeptic's extremely useful weekly roundup of neuroscience makes the point of group bias quite clearly with a hypothetical example, and highlights the possibility that in selecting healthy controls we might accidentally set the bar higher than for the target group, introducing a potential confound to the experiment: Beware the "super well" - why the controls in psychology research are often too healthy.

Obvious? It should be, to a careful experimentalist. But there are insidious ways this selection bias can creep into your studies, making the point worth repeating ad nauseam in my opinion, especially to the waves of newcomers to our field. (Preach this lesson to all incoming students!) I'm going to make the unsubstantiated statement that subject selection (and its alliteration!) ranks above both acquisition and post-processing methods when it comes to biases and the ability to get an incorrect result with fMRI. It's critically important to balance physiological as well as psychological profiles as closely as possible between experimental and control groups.

The insidious biases? Whenever one or other group is difficult to recruit, for demographic reasons or whatever, there is a tendency to let certain things slide in order to net the requisite total. Don't cut this corner! Match as many factors as you possibly can, then note any factors that you can't match and include them in your experiment as covariates of no interest. In this way you might avoid the embarrassment of interpreting a neural difference for something that is better explained by physiology; hematocrit levels, say.

Remember, your fMRI experiment starts when you start recruiting subjects. And the less rigorously you do this fundamental, crucial step the more likely you are to get big error bars, or worse. Even I can't help your data at that point!

Tuesday, October 26, 2010

Resting state fMRI: is there an optimal protocol?

With resting state fMRI (rs-fMRI) and functional connectivity booming, and an increasing number of fMRIers adding a resting state scan to their otherwise task-based protocols (even if they don't know what they'll do with the data), the question of whether there is an optimal protocol, perhaps even a standard that could be established across multiple centers, seems timely. From my limited investigation it appears that many fMRIers are doing the logical thing: they are using a version of their task-based fMRI experiment for their resting state acquisition. Is that a good, bad or indifferent thing to do?

A recent review from van Dijk et al. (J. Neurophysiol. 103, 297-321, 2010) set out to determine whether parameters such as run duration, temporal resolution (i.e. TR), spatial resolution (voxel size) and a series of processing steps made any appreciable difference to the detection of default mode and attention networks, against a reference network (a set of nodes not expected to have functional connectivity). Their findings can be summarized as follows: